Basic operation
This section describes basic operation of the Arena UI. The program can be started from Ubuntu’s Dash menu.
User interface layout
The basic layout of the user interface is shown in next figure:

Basic elements of the Arena UI
- Basic layout is divided into 5 different areas:
- Menu pane
- Arena state visualization
- Configuration tabs
- CASU state treeview
- Group selection treeview
Most of elements of the Arena UI can be resized with sliders betweem them. If slider is moved close to the edge of some element, that element will be hidden. It can be brought back with moving the slider from edge, revealing the hidden element.
The arena state visualization area
Visualization area represents CASU arena and units with their relative positions in it. User can zoom in/out and scroll with following commands:
Zoom in/out Ctrl + mouse scroll
Scrolling up/down mouse scroll
Scrolling left/right Alt + mouse scroll
Fast scrolling is enabled by holding additional Shift modifier.
The connection status and sensor values of all CASUs can be visualized, and actuator setpoints can be provided.
- Physical position
- CASUs are visualized at their respective positions (as specified in the .assisi file); Orientation is indicated by a short dash.
- Selections status
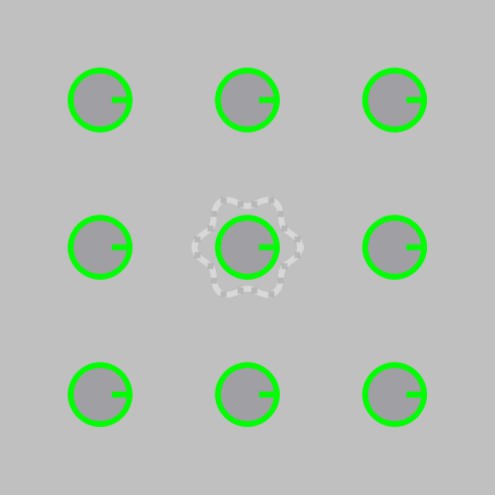
Selected CASUs are indicated by a dashed outline, whereas unselected CASUs have a solid outline. If two or more CASUs are grouped together, visualization will shown them in unique color and connect them with dashed line when selected.
A treeview with actuator setpoints and sensor values appears in the Casu data configuration tab for each selected CASU.
- Connection status
- Unconnected CASUs have a red outline, connected CASUs have a green outline.
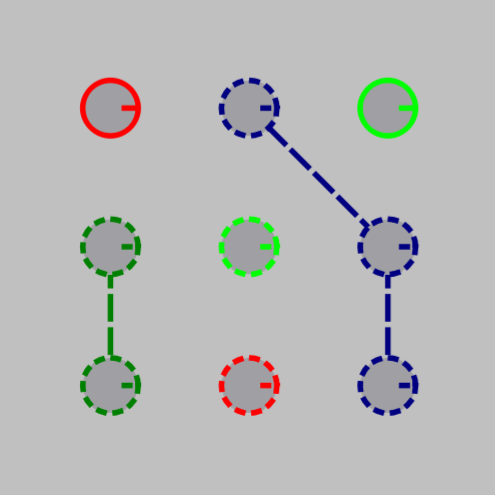
Example of connected/unconnected CASUs, selected/unselected CASUs and grouped CASUs
- Proximity sensor readings
- Proximity sensor readings are visualized as six triangles radiating out of the CASU body. Size of triangle depends on read proximity value.
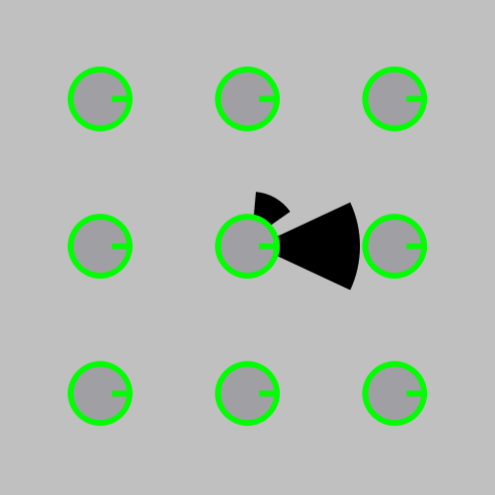
Proximity sensor visualization
- Diagnostic LED actuator
- Diagnostic LED state is indicated by the color of the CASU body.
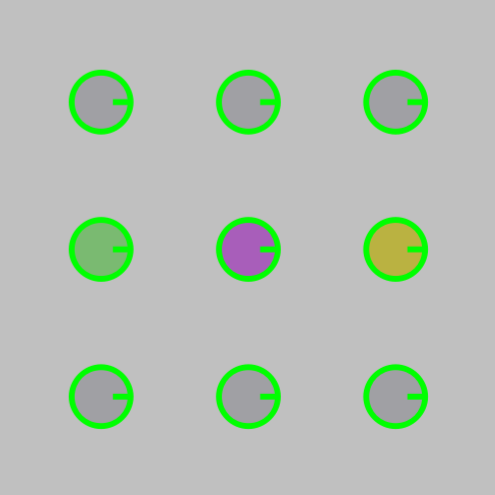
Led color visualization
- Airflow actuator
- When the airflow actuator is turned on, an animation of a fan is displayed over the CASU body.
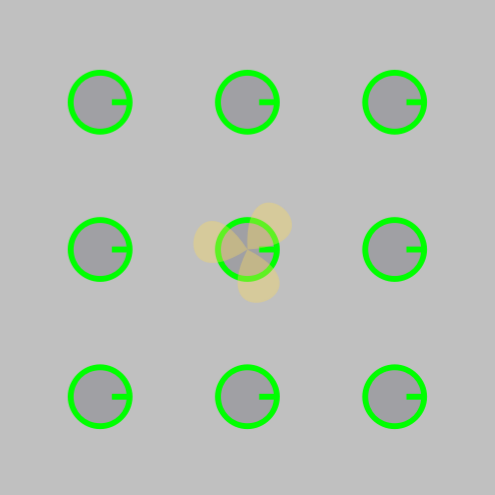
Airflow status visualization
- Vibration actuator
- When the vibration actuator is turned on, an animation of a vibrating dotted band is displayed around the CASU body.
Vibration status visualization
- Context menu (right mouse click in the arena visualization area)
- Toggle marker visability
- proximity markers
- temperature markers
- vibration marker
- airflow marker
- avg. sample time
- Group Selected (Ctrl+G)
- Ungroup selected (Ctrl+U)
- Set connection (Ctrl+C)
- Setpoint (submenu)
- Temperature (F1)
- Vibration (F2)
- Airflow (F3)
- IR Proximity (F4)
- LED (F5)
- VibrationPattern (F6)
Configuration tabs
Switching between tabs user has access to different features for monitoring and communication with real CASU units.
- Casu data
- Tab is populated with two treeview widgets for monitoring selected CASU units. All numerical values are shown for all sensor values and actuator setpoints.
The CASU treeview is shown in the Casu data Configuration tab for selected CASUs. The treeview can be expanded to show numerical values for all actuator setpoints and sensor values. Several devices can be selected simultaneously by clicking and dragging on their name in the treeview. A context menu, accessed by right-clicking on a device name, enables the plotting of sensor value trends in time, as described in more detail in Displaying data trends.
See Displaying CASU data.
- Trend graphs
In order to monitor the progress of experiments, the User interface has the ability to plot the trends (time responses) all sensor values.
- Deployment
Currently loaded project files are shown on top, and bellow are buttons for operating the pre-written program sequences and simulator accompanied with textual output box where user can catch shell messages.