Basic operation
This section describes basic operation of the Arena UI. The program can be started from Ubuntu’s Dash menu.
User interface layout
The basic layout of the user interface is shown in Figure Basic elements of the Arena UI..
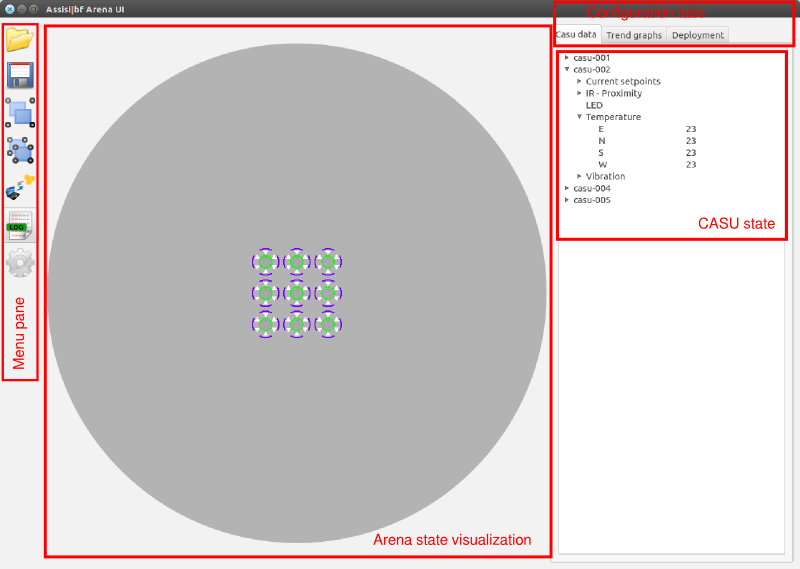
Basic elements of the Arena UI.
The arena state visualization area
The connection status and sensor values of all CASUs can be visualized, and actuator setpoints can be provided.
- Physical position - CASUs are visualized at their respective positions (as specified in the .assisi file); Orientation is indicated by a short dash;
- Selections status - CASUs are selected by left mouse click; selected CASUs are indicated by a solid outline, whereas unselected CASUs have a dashed outline; a treeview with actuator setpoints and sensor values appears in the Casu data configuration tab for each selected CASU; Ctrl-Click on an CASU toggles its selection state;
- Connection status - Unconnected CASUs have a red outline, connected CASUs have a green outline;
- Temeprature readings - Temperature readings are displayed as circular segments at 2cm distance from the CASU body; They are color-coded, with a colorbar displayed in the bottom-left corner of the visualization area;
- Proximity sensor readings - Proximity sensor readings are visualized as six triangles radiating out of the CASU body;
- Diagnostic LED actuator - Diagnostic LED state is indicated by the color of the CASU body;
- Airflow actuator - When the airflow actuator is turned on, a shaded circular area is displayed around the CASU body;
- Context menu - Activated by right-click in the arena visualization area; Enables on/off toggling of sensor visualizations, CASU grouping/ungrouping, customizing connection settings and providing actuator setpoints
CASU state treeview
The CASU treeview is shown in the Casu data Configuration tab for selected CASUs. The treeview can be expanded to show numerical values for all actuator setpoints and sensor values. Several devices can be selected simultaneously by clicking and dragging on their name in the treeview. A context menu, accessed by right-clicking on a device name, enables the plotting of sensor value trends in time, as described in more detail in `Displaying data trends`_.